- Business
- Esoteric
- Fitness & Gym
- Health
- Hypnosis
- Management
- Marketing & Selling
- Massage – SPA
- Parenting
- PUA Seduction
- Science
- Self Improvement
- Art
- Investing
- Painting & Sculpting
- Tai Chi & Martial Arts
- Qigong
- Taoism
- Design & Graphics
- Medicine
- Exams
- Spirituality & Religion
- Hobbies & Fixing & Woodworking
- Photography & Film Making
- Networking & Lan
- Forex & Trading
- IQ & Memory
- Vision & Eye Care
- Swimming & Scuba diving & Water Sports
- Security & Hacking
- Travel
- Cooking
- Driving & Flighting
- Languages
- Computers & Programming
- Building & Home Improvement
- Music
- Astronomy
- History
- Mathematics
- Philosophy
- Literature & Writing
- Economics & Finance
- Sewing
- Hunting
- Electronics
- Psychology & Psychiatry
-75%

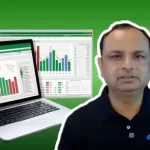
Excel Charts | Create Clear and Impactful Visuals
Original price was: $20.00.$5.00Current price is: $5.00.
Excel Functions | Master the Essential Tools for Daily Work
Original price was: $20.00.$5.00Current price is: $5.00.
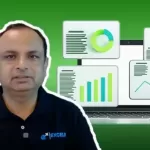
Excel Dashboard | Build Interactive, Professional Dashboards
Original price was: $20.00.$5.00Current price is: $5.00.
Description
Published 11/2025
MP4 | Video: h264, 1280×720 | Audio: AAC, 44.1 KHz, 2 Ch
Language: English | Duration: 1h 2m | Size: 837 MB
Turn raw data into insights using charts, PivotTables, slicers, and modern design principles.
What you’ll learn
Build clean, interactive dashboards from scratch
Use PivotTables, slicers, and charts to generate insights
Apply layout, colour, and design best practices
Automate refreshes using Power Query (if applicable)
Requirements
Basic Excel knowledge
No prior analytics or design experience needed
Description
Dashboards have become the go-to way for professionals to present information quickly, whether you’re in business, finance, HR, operations, marketing, or analytics. Instead of scrolling through endless spreadsheets, leaders expect a single screen that highlights what matters most. This module shows you how to turn everyday Excel data into dashboards that feel polished, intuitive, and presentation-ready.Rather than jumping straight into visuals, you’ll first understand how great dashboards are built: from organising raw data and preparing it for analysis to structuring tables that are easy to maintain. Once the foundation is set, you’ll move into the tools that bring dashboards to life — PivotTables, PivotCharts, slicers, timelines, and simple design methods that make your work look clean and intentional.Throughout the module, you’ll see these concepts applied in real business scenarios. You might analyse sales trends, track performance KPIs, compare team productivity, or summarise financial outcomes. Each example shows you how dashboards replace bulky reports with visuals that guide decision-making instantly.You’ll also refine the craft of presenting data: choosing the right chart for your story, arranging elements neatly, using colour with purpose, and avoiding clutter. And if you want to go deeper, you’ll discover how Power Query and Power Pivot can automate updates so your dashboards stay current without any manual effort.By the time you finish, you’ll know how to build dashboards that are not only functional but also impressive — the kind that fit effortlessly into presentations, weekly reviews, client reports, and portfolio projects. These are practical, job-ready skills that make your insights stand out.
Who this course is for
Working professionals, analysts, managers, freelancers, and learners building portfolios.
Homepage
https://www.udemy.com/course/excel-dashboard-build-interactive-professional-dashboards/
Shipping & Delivery
DIGITAL DELIVERY ONLY
This is digital product THE DOWNLOAD LINK SEND 12-24 HOURS AFTER UPON PURSUASE AND PAYMENT CLEARS"
- The digital files are uploaded on PCLOUD
- 12-24 hours delivery time
- the download links expire after 7 days and need to download them
- to renew the download link after expiration have one additional fee $5 per product
REQUESTS
Also we accept requests and course exchanges
In Course exchanges we are sending credits only
The credits will be the same price as we can sell course
"REFUNDS & RETURNS"
No Refunds on digital product
ONLY EXCHANGE
- Because of the abuse of the refunds from many customers i don't accept refunds
- We accept only 1 time exchange with product of the same price
- if you done mistake on the exchangeable product i don't recognize it as your mistake
- Exchanges only 3 days after the payment of your digital product. (if abused again i will do it 1 day)


